
A WordPress admin slow to respond is one of the most common complaints I hear from site owners and editors. The public site may feel fast, while saving a post, opening the Plugins screen or loading WooCommerce orders crawls. It is frustrating, it wastes time, and it often points to a problem that will eventually affect visitors too.
This guide explains why the admin behaves differently from the front end, how to find the cause with Query Monitor, and the fixes that usually help, from Heartbeat settings to autoloaded options and hosting resources.
WordPress admin slow but the front end fast?
Most visitors see cached pages. A page caching plugin or your host stores a ready-made copy of each page, so WordPress barely has to work. The admin area is never served from that cache. Every screen is built fresh, and every active plugin gets a chance to run its admin code.
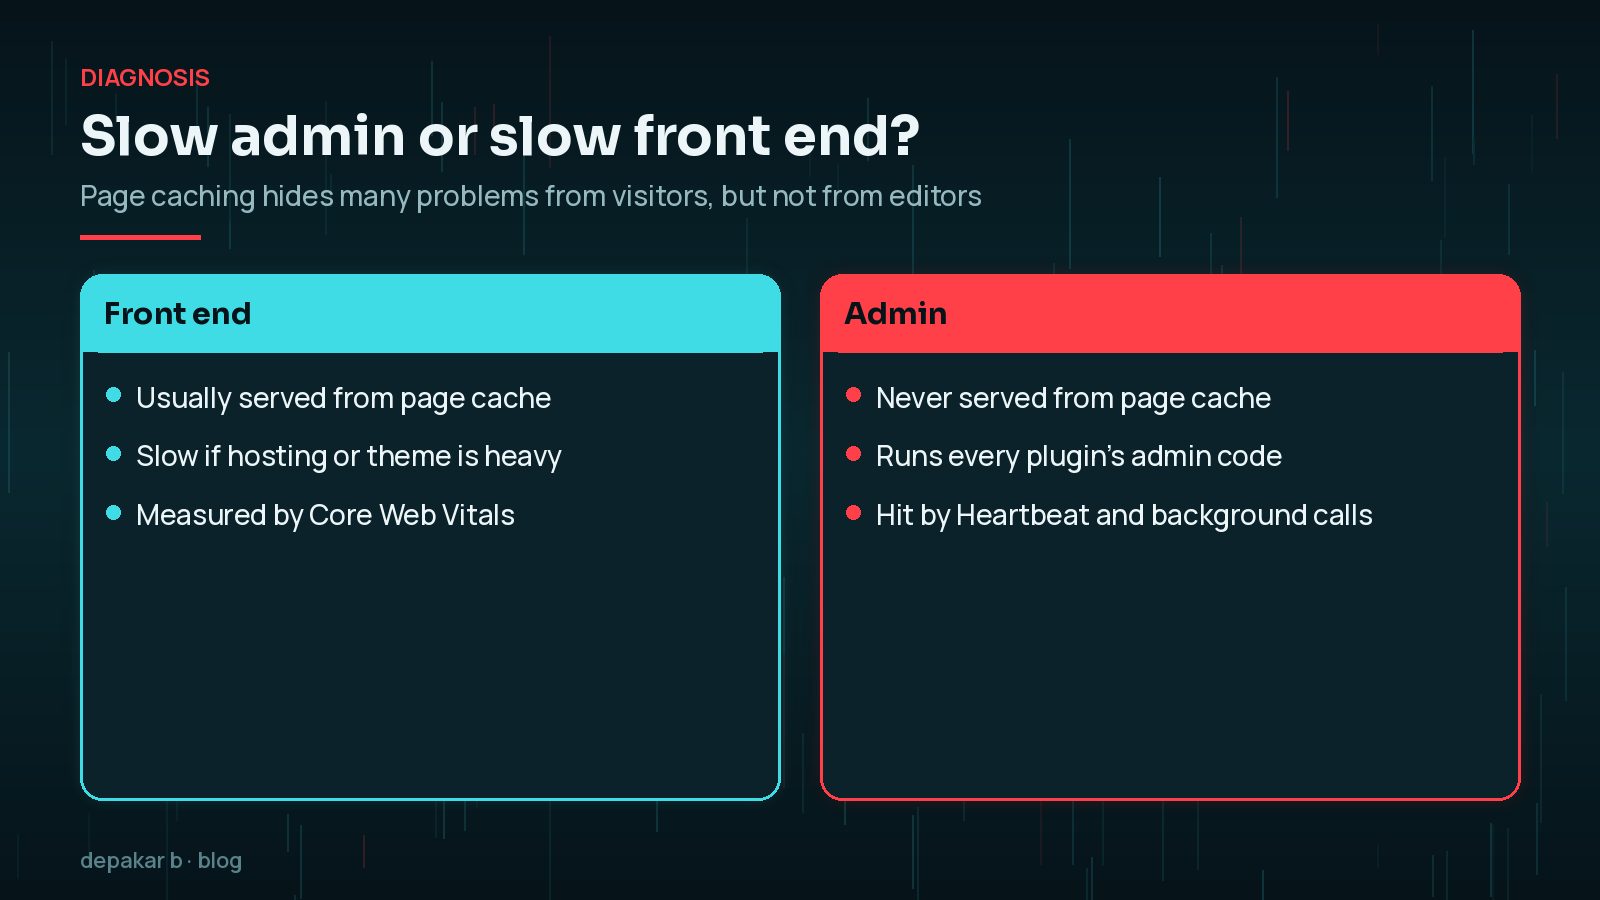
That is why a slow dashboard is a useful warning sign. It shows how quickly your site really runs without caching. For how caching layers work, see WordPress caching explained.
Finding the cause with Query Monitor
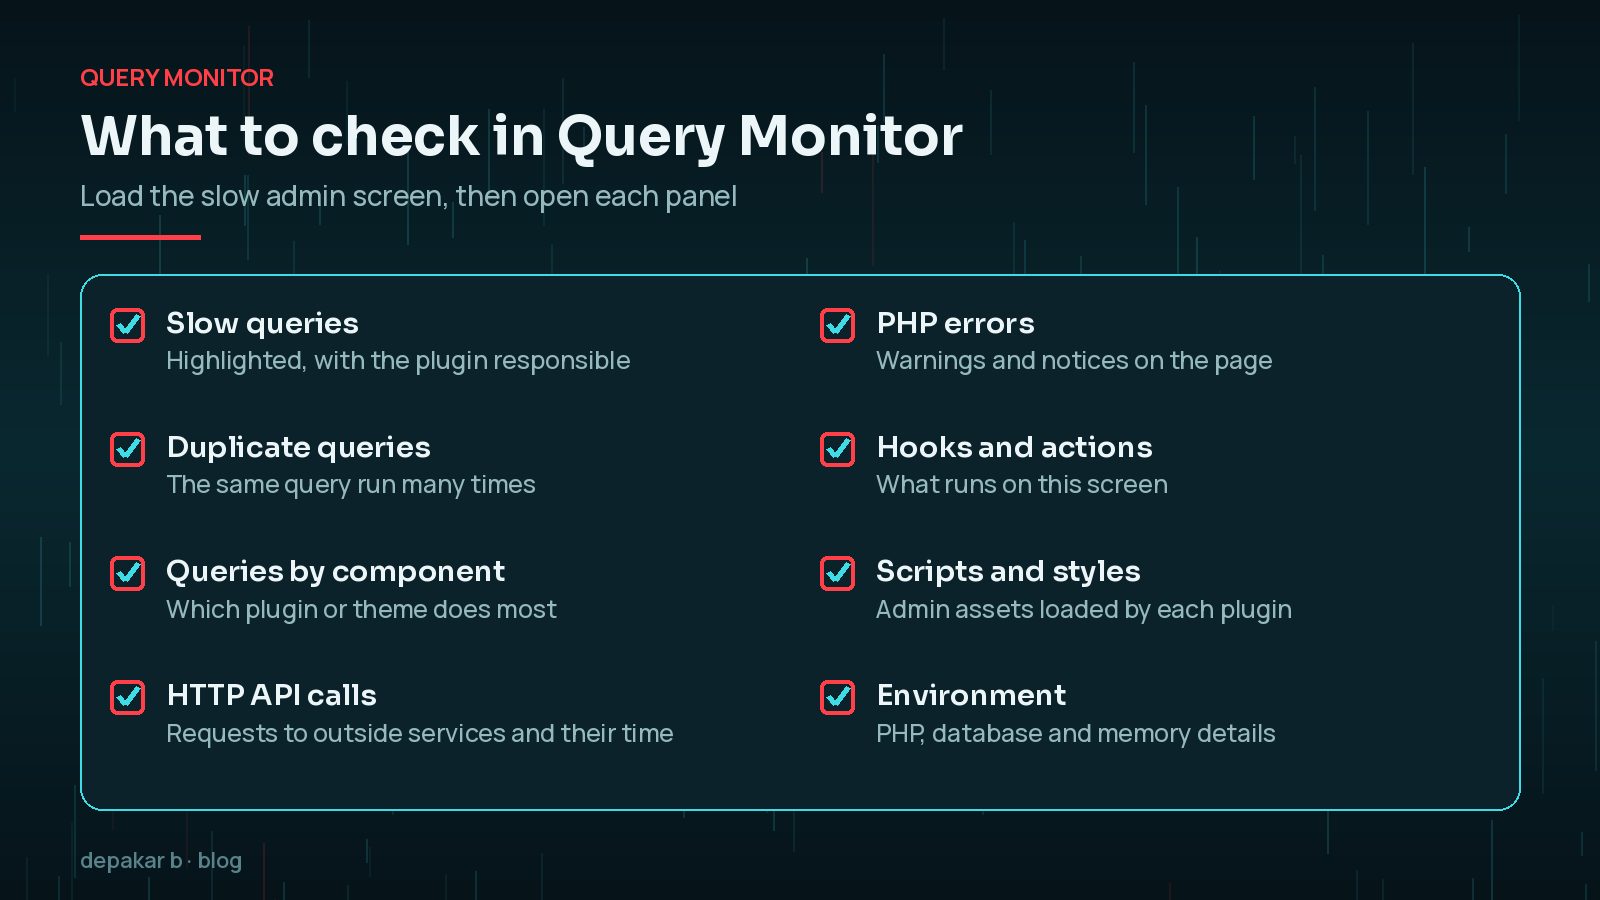
Query Monitor is a free developer tools panel for WordPress. Its plugin page explains that it shows database queries, PHP errors, hooks, scripts, HTTP API calls and more, and can group them by the plugin or theme responsible, which makes it quick to spot a poorly performing component.
- Install it on a staging copy if you can, or on live for a short time.
- Open the slow admin screen and look at the toolbar summary: page generation time, query count and memory.
- Check “Queries by Component” to see which plugin runs the most or slowest queries.
- Check “HTTP API Calls” for requests to outside services that take seconds to respond.
Deactivate Query Monitor when you have finished, as it adds its own overhead.
Heartbeat API and autosave
The Heartbeat API lets the browser and server talk in near real time. According to WordPress's developer handbook, it sends a request on an interval, or “tick”, of between 15 and 120 seconds, handled through admin-ajax.php. It powers post locking, login expiry warnings and autosave.

Each request is small, but several editors with many open tabs can create a steady stream of uncached requests. If your host shows high CPU from admin-ajax.php, Heartbeat or a plugin using admin-ajax is a likely cause. You can lengthen the interval with the heartbeat_settings filter in a small plugin:
add_filter( 'heartbeat_settings', function ( $settings ) {
          $settings['interval'] = 60; // between 15 and 120 seconds
          return $settings;
      } );
Autosave runs every 60 seconds by default; the AUTOSAVE_INTERVAL constant in wp-config.php changes it. Avoid switching Heartbeat off completely, as you lose post locking and autosave protection.
Plugins that call home or run heavy queries
Plugins are the most common cause of a slow dashboard. Watch for:
- Remote calls: licence checks, news feeds or update checks that contact outside servers on every admin page load.
- Heavy dashboard widgets: statistics and reports that run large queries each time you open the dashboard.
- Inefficient queries: searches across big tables without proper indexes.
- Admin assets everywhere: scripts loaded on every screen rather than only where they are needed.
A quick way to confirm a suspect is to test on a staging copy: deactivate plugins one at a time and time the same admin screen after each change. When the screen suddenly speeds up, you have found the culprit, or at least the biggest contributor. Keep notes, because two or three plugins together are sometimes responsible.
Once Query Monitor points to a plugin, check for an update, adjust its settings, or replace it. It is not the number of plugins that matters most but what each one does; see are too many WordPress plugins a problem?
Autoloaded options and the database
WordPress loads “autoloaded” options from the database on every request, admin included. Over the years, plugins add options, and many leave them behind after being removed.
WordPress 6.6 improved this. Large options over 150 KB are no longer autoloaded by default unless a plugin explicitly asks for it, and Site Health shows a critical issue, “Autoloaded options could affect performance”, when the total size of autoloaded options exceeds 800 KB. Check Tools > Site Health for that warning.
Hosting resources and PHP workers
Every uncached request, including each admin screen and each Heartbeat call, needs a PHP process to handle it. Hosting plans limit how many can run at once, often called PHP workers, and how much memory each one gets.

When all workers are busy, requests queue and the dashboard feels sluggish, even if each request is quick on its own. Site Health's Info tab lists your PHP version, memory limit and database details, which is a useful starting point when talking to your host. A slow server response affects visitors too; see how to reduce TTFB in WordPress.
Fixes that keep editors happy
Work from the cheapest change to the most involved, and measure after each one.
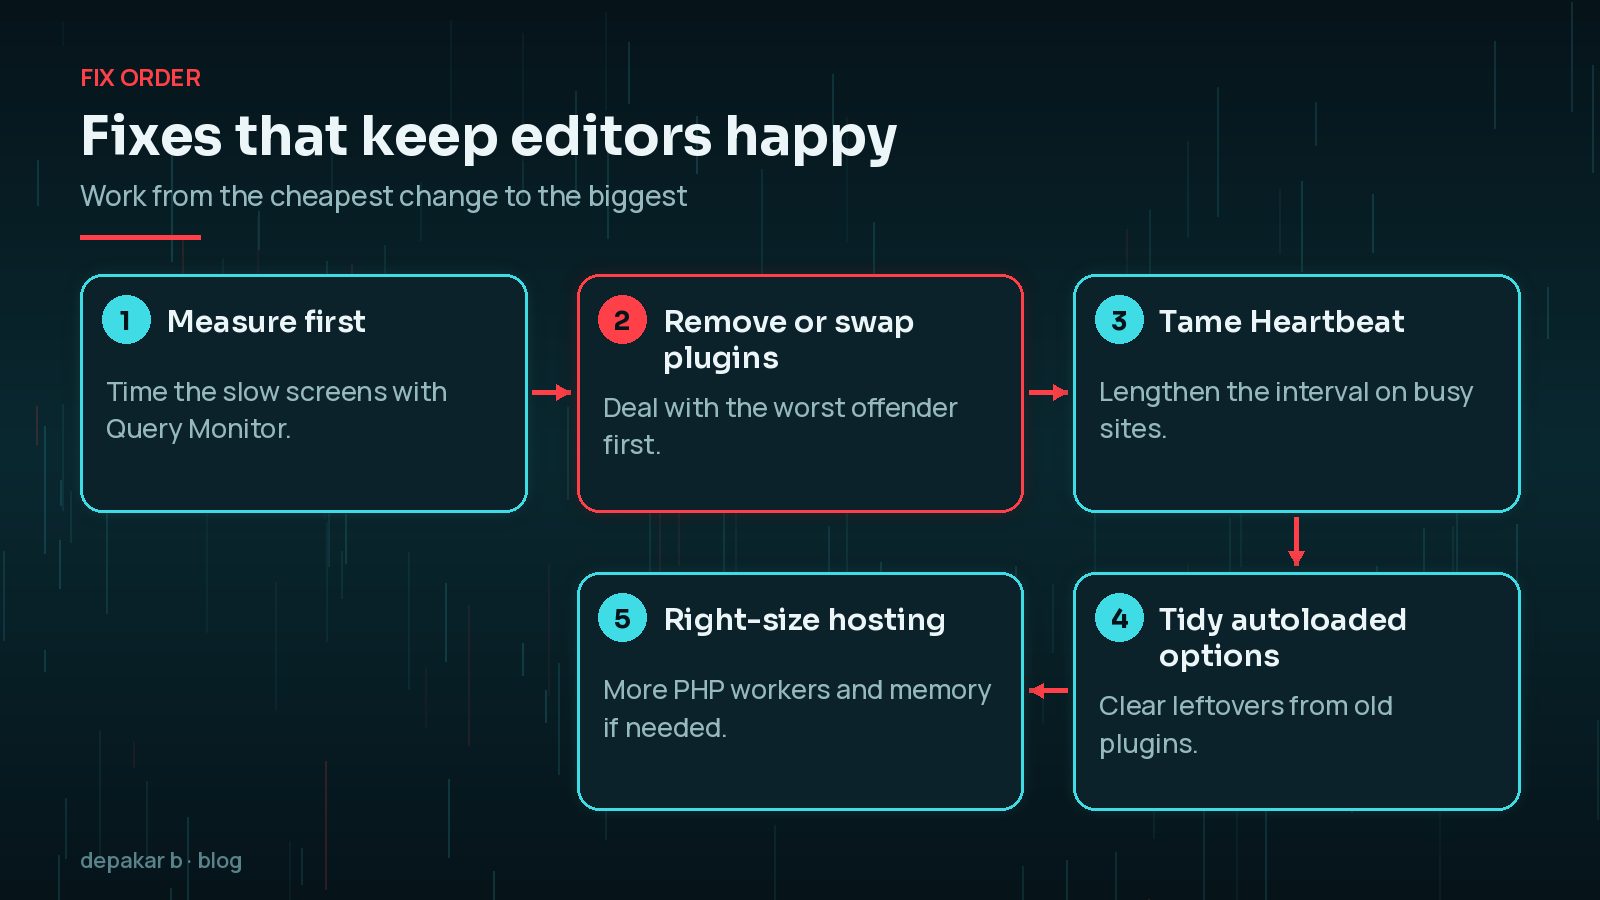
- Update WordPress, plugins and PHP to supported versions.
- Remove or replace the plugin Query Monitor identifies as the slowest.
- Turn off dashboard widgets you never use, via Screen Options.
- Lengthen the Heartbeat interval on busy multi-editor sites.
- Clear leftover autoloaded options from removed plugins, after a backup.
- Ask your host about PHP workers, memory and object caching if limits are reached.
Frequently Asked Questions
Why is my WordPress admin slow but the website fast?
Visitors usually see cached pages, while admin screens are always built fresh and run every plugin's admin code. Heavy plugins, Heartbeat requests and hosting limits show up there first.
Should I disable the Heartbeat API?
Usually not completely, because it powers autosave, post locking and login warnings. Lengthening the interval with the heartbeat_settings filter is a safer option on busy sites.
Is Query Monitor safe to use on a live site?
It is widely used for debugging and only shows its output to administrators, but it adds overhead. Use it on staging where possible, or briefly on live, and deactivate it afterwards.
What does admin-ajax high CPU mean?
Many requests are hitting admin-ajax.php, often from Heartbeat or plugins that use it for background tasks. Query Monitor and server logs help identify the source.
Will better hosting fix a slow dashboard?
It can help if you are hitting PHP worker or memory limits, but it will not fix an inefficient plugin. Find the cause first, then decide whether hosting is the bottleneck.
Final Thoughts
When the WordPress admin is slow, the cause is usually something you can find and fix: a heavy plugin, a busy Heartbeat, bloated autoloaded options or hosting limits. Measure with Query Monitor, fix the biggest cause first, and recheck after each change. A faster dashboard saves your team time every day. If you would like a hand, my speed and performance service covers admin performance as well as the public site.
Official References
Sources checked on 29 October 2026: