
You run your site through PageSpeed Insights, get a 62, run it again and get a 71. Meanwhile the box above says your site passes the Core Web Vitals assessment. Which one should you care about? Understanding PageSpeed Insights score vs Core Web Vitals saves you a lot of wasted effort, because they measure different things in different ways.
This guide explains why the score moves, what lab and field data mean, what the assessment is based on, and where to focus if you want a faster site and better search performance.
Why Your PageSpeed Score Keeps Changing
The 0-100 performance score comes from Lighthouse, which loads your page once in a simulated environment. Google's PageSpeed Insights documentation notes several common sources of variability, including network availability, hardware availability and resource contention on the testing machine.
Your site also changes between runs: caches may be warm or cold, adverts and third-party scripts may load differently, and a server may respond faster or slower. A swing of several points between runs is normal.
That's why a single score is a poor way to judge a change. Run several tests and look at the individual metrics rather than the headline number.
Lab Data vs Field Data
PageSpeed Insights shows two kinds of data, and Google's documentation explains why they can disagree.
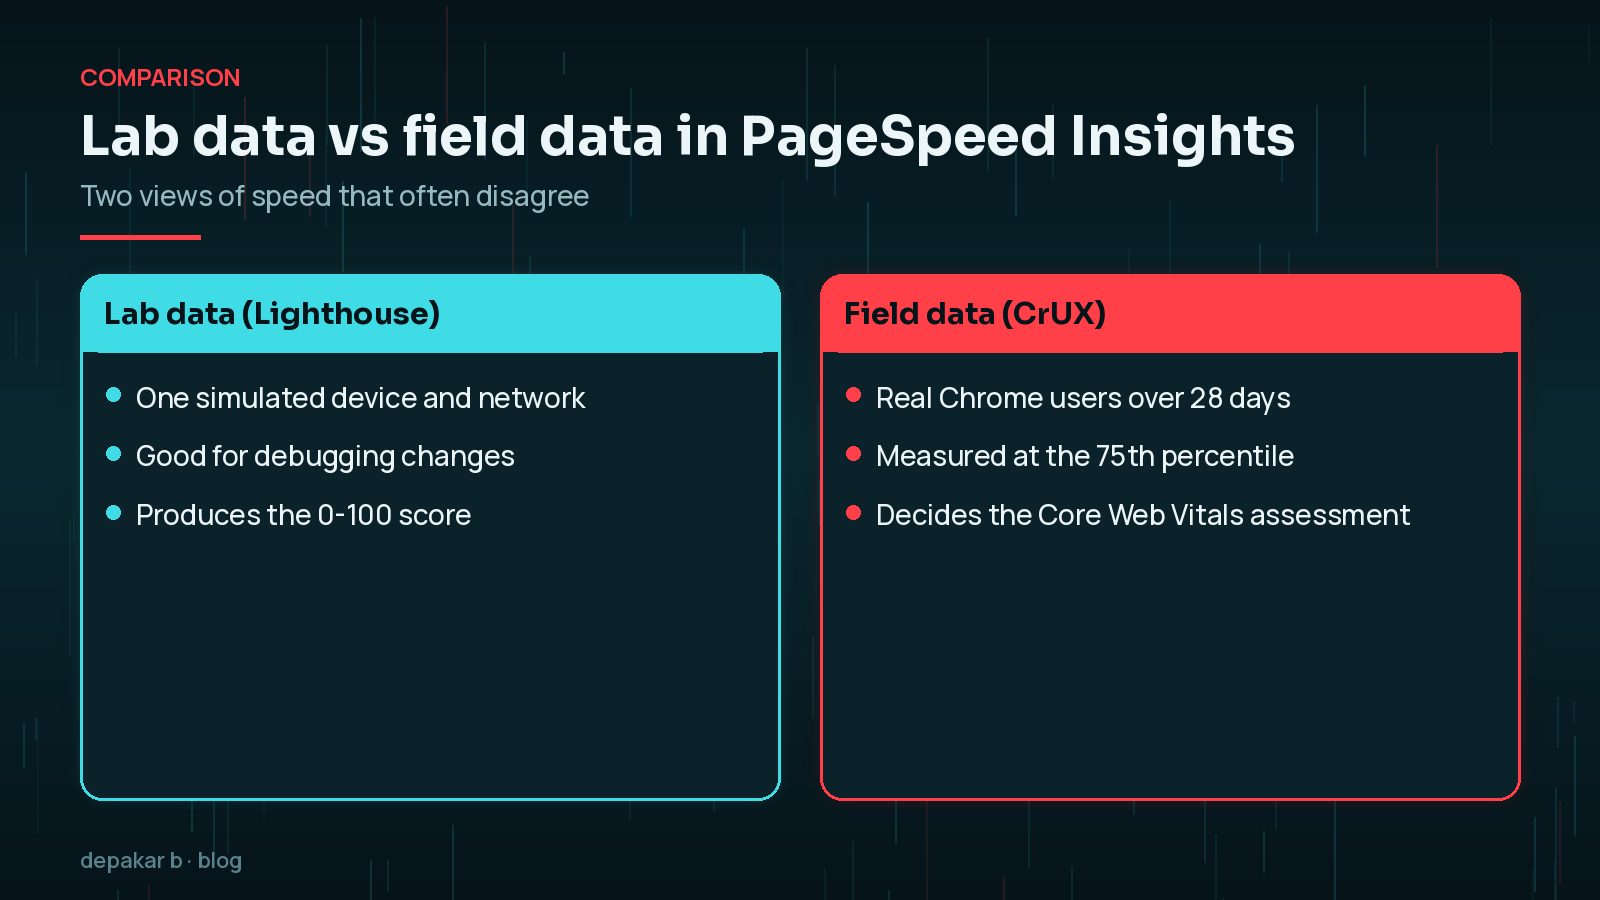
- Lab data is a simulated load of the page on a single device with a fixed set of network conditions. Google says it is useful for debugging because it's collected in a controlled environment, but it may not capture real-world bottlenecks.
- Field data comes from the Chrome User Experience Report (CrUX): anonymised data from real Chrome users on many devices and networks, over the previous 28 days.

Lighthouse also can't measure Interaction to Next Paint (INP), because there is no real user interacting. web.dev suggests using Total Blocking Time (TBT) in the lab as a stand-in.
Field data needs enough real visits. Google notes that a page may not have field data if it is new or has too few samples, in which case PSI may show origin-level data for the whole site, or none.
What the Core Web Vitals Assessment Means
The Core Web Vitals assessment at the top of PageSpeed Insights is based on field data. The three metrics and their "good" thresholds, from web.dev, are:
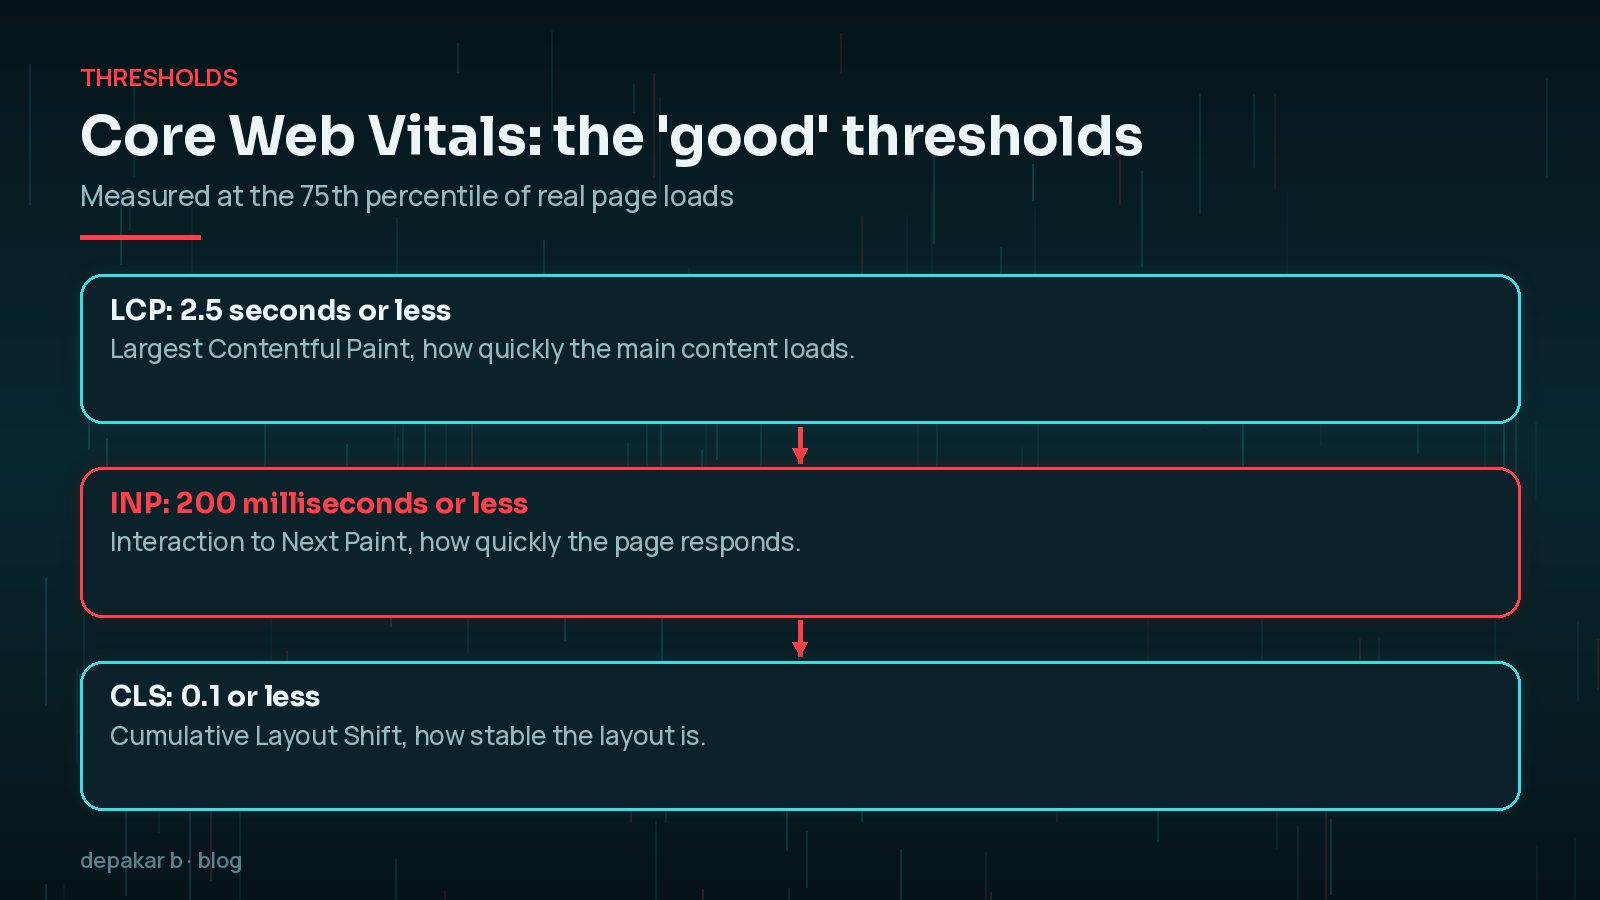
- Largest Contentful Paint (LCP): 2.5 seconds or less.
- Interaction to Next Paint (INP): 200 milliseconds or less.
- Cumulative Layout Shift (CLS): 0.1 or less.
Each is measured at the 75th percentile, so most visits need to meet the target, not just the average. According to the PSI documentation, a page or origin passes if the 75th percentile of all three metrics is good. If there isn't enough INP data, it can pass on LCP and CLS alone.
PageSpeed Insights Score vs Core Web Vitals: Does a 100 Help Rankings?
Google's Core Web Vitals documentation recommends that site owners achieve good Core Web Vitals for success with Search, and says this aligns with what its core ranking systems seek to reward. Those are measurements from real users.
Google's documentation doesn't present the Lighthouse score itself as a ranking target. A page can score 100 in the lab and still have poor field data, or score 70 and pass comfortably. Chasing 100 often means spending time on changes real visitors never notice.
Rule of thumb: use the score and its diagnostics to find problems; use field data to decide whether they matter. Good page experience is one part of ranking alongside relevant, helpful content.
Mobile vs Desktop Scores
PageSpeed Insights reports mobile and desktop separately. The mobile lab test simulates a phone on a slower connection, so mobile scores are often lower than desktop.
The field data is split by device too. Since many small business visitors arrive on phones, the mobile field data is usually the one to watch. web.dev recommends measuring the 75th percentile segmented across mobile and desktop.
If mobile struggles while desktop is fine, typical causes include heavy JavaScript, large hero images and third-party scripts that a phone's processor handles less easily. Test on a real mid-range phone too, as it often reveals delays that a fast laptop hides.
Which Metrics to Prioritise
Start with whichever Core Web Vital fails in your field data, on the device most of your visitors use:
- LCP failing: look at server response time, the hero image and render-blocking CSS and fonts. See improving LCP on WordPress.
- INP failing: look at heavy JavaScript, page builders and third-party scripts. See fixing INP on WordPress.
- CLS failing: look for images without dimensions, late-loading banners and font swaps. See fixing CLS on WordPress.
If all three pass, further speed work may still help users and conversions, but it's no longer urgent. My WordPress speed optimisation checklist covers the wider picture.
How to Track Real-User Performance Over Time
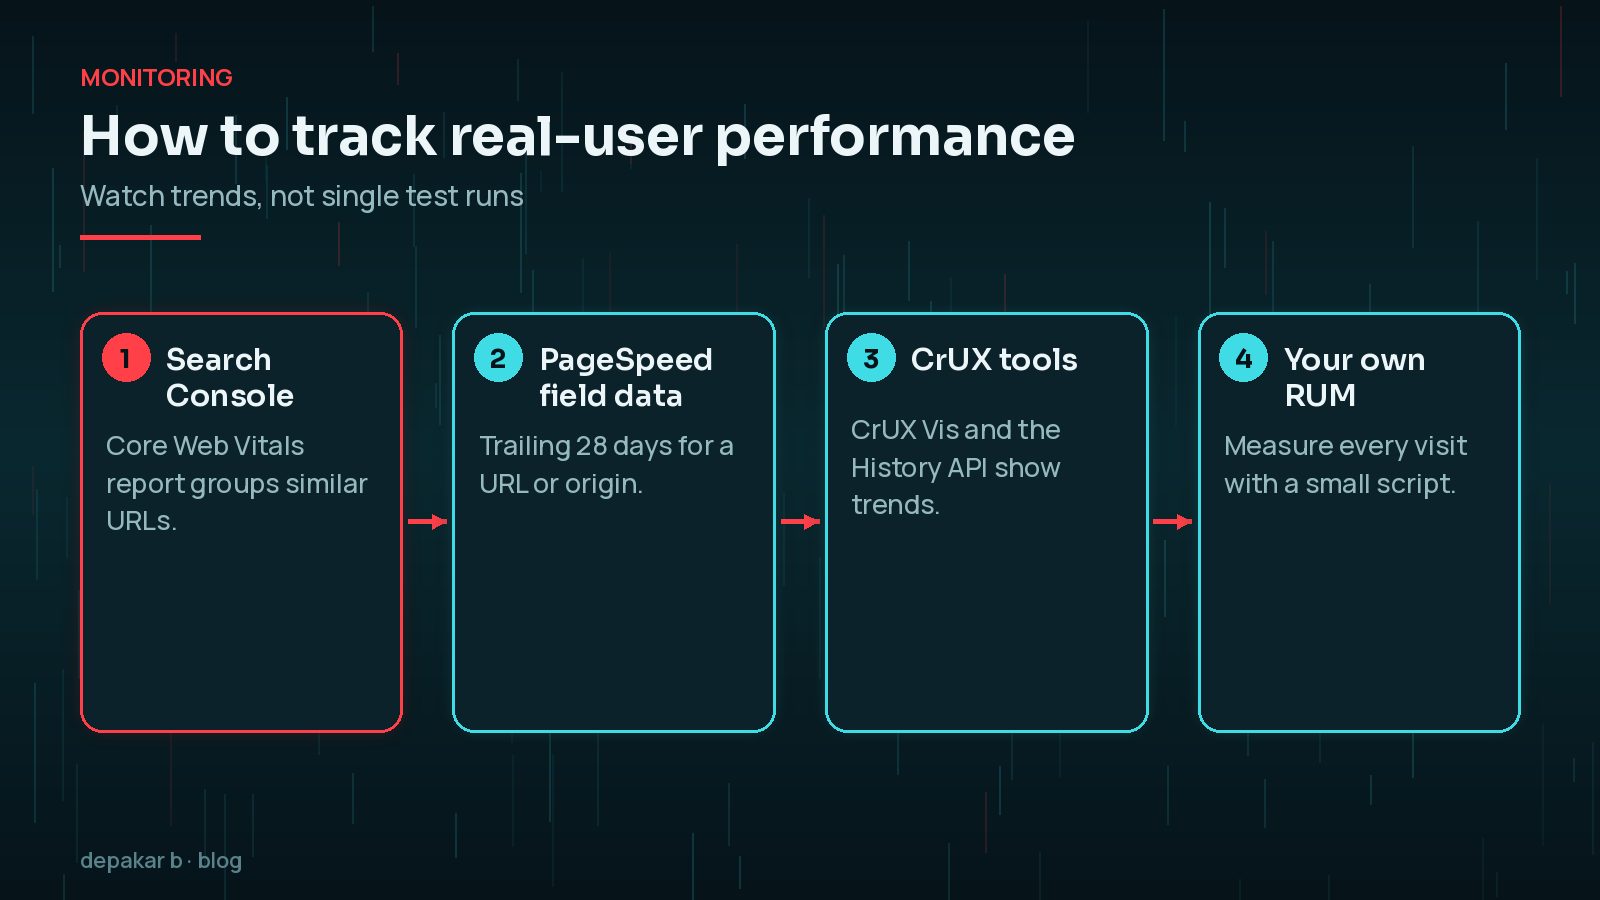
- Search Console's Core Web Vitals report groups similar URLs and shows how they perform for real users. Google recommends checking it.
- PageSpeed Insights field data shows the trailing 28 days for a URL or your whole origin.
- CrUX tools such as CrUX Vis and the CrUX History API show how your origin has changed over time.
- Your own real-user monitoring, using a small script such as Google's web-vitals library, measures every visit, including pages without enough traffic for CrUX.

Because field data covers 28 days, improvements take weeks to show fully. Make one change at a time, note the date, and check the trend afterwards. A simple change log beside your monitoring makes it much easier to see what actually helped.
Frequently Asked Questions
Why does my PageSpeed Insights score change every time?
The score comes from a single simulated Lighthouse run, which varies with network conditions, testing hardware and how your server and scripts respond. Run several tests and focus on individual metrics.
Is a PageSpeed score of 100 needed for SEO?
No. Google recommends good Core Web Vitals, which are measured from real users. A lab score of 100 isn't required, and chasing it often has little real benefit.
What is the difference between lab data and field data?
Lab data is a simulated page load on one device and network. Field data is real Chrome users' experience over the previous 28 days, from the Chrome User Experience Report.
Why does PageSpeed Insights say no field data is available?
CrUX needs enough real visits to a public page. New or low-traffic pages may have no data, in which case PSI may show origin-level data instead.
Should I focus on mobile or desktop scores?
Focus on the device most of your visitors use, which is often mobile. Look at mobile field data first.
Final Thoughts
The PageSpeed Insights score vs Core Web Vitals question comes down to this: the score is a lab diagnostic, while the Core Web Vitals assessment reflects real users. Use the first to find problems and the second to decide what matters, and track trends over weeks.
If your field data is failing and you'd like help, my speed and performance service focuses on the metrics that affect real visitors.
Debug in the lab, judge by the field, and give changes time to show.
Official References
Sources checked on 29 October 2026: